import matplotlib.pyplot as plt
from mpl_toolkits.mplot3d import Axes3D
import numpy as np
def crear_plot():
fig = plt.figure()
ax = fig.add_subplot(111, projection='3d')
# Graficar las flechas de los ejes principales
ax.quiver(0, 0, 0, 5, 0, 0, color='r', linewidth=1, arrow_length_ratio=0.1) # Eje X
ax.quiver(0, 0, 0, 0, 5, 0, color='g', linewidth=1, arrow_length_ratio=0.1) # Eje Y
ax.quiver(0, 0, 0, 0, 0, 5, color='b', linewidth=1, arrow_length_ratio=0.1) # Eje Z
# Etiquetas de los ejes
ax.text(5.2, 0, 0, 'X', fontsize=12, color='black')
ax.text(0, 5.2, 0, 'Y', fontsize=12, color='black')
ax.text(0, 0, 5.2, 'Z', fontsize=12, color='black')
# Configurar los límites de los ejes
plot_limit_inf = 5
plot_limit_sup = 5
ax.set_xlim(-plot_limit_inf, plot_limit_sup)
ax.set_ylim(-plot_limit_inf, plot_limit_sup)
ax.set_zlim(-plot_limit_inf, plot_limit_sup)
# Configurar los ejes
ax.set_xlabel('Eje X')
ax.set_ylabel('Eje Y')
ax.set_zlabel('Eje Z')
return fig, ax
def trasladar_y_rotar_ejes(tras_m, rot_m, eje_x, eje_y, eje_z):
rot_eje_x = tras_m @ rot_m @ eje_x
rot_eje_y = tras_m @ rot_m @ eje_y
rot_eje_z = tras_m @ rot_m @ eje_z
return rot_eje_x, rot_eje_y, rot_eje_z
# Crear la figura
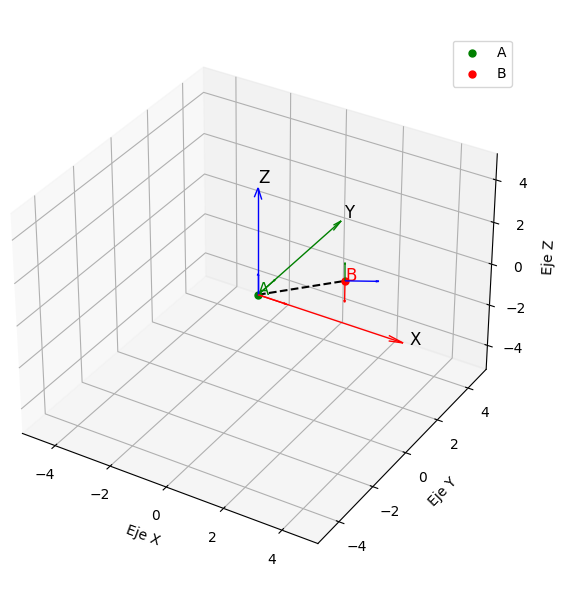
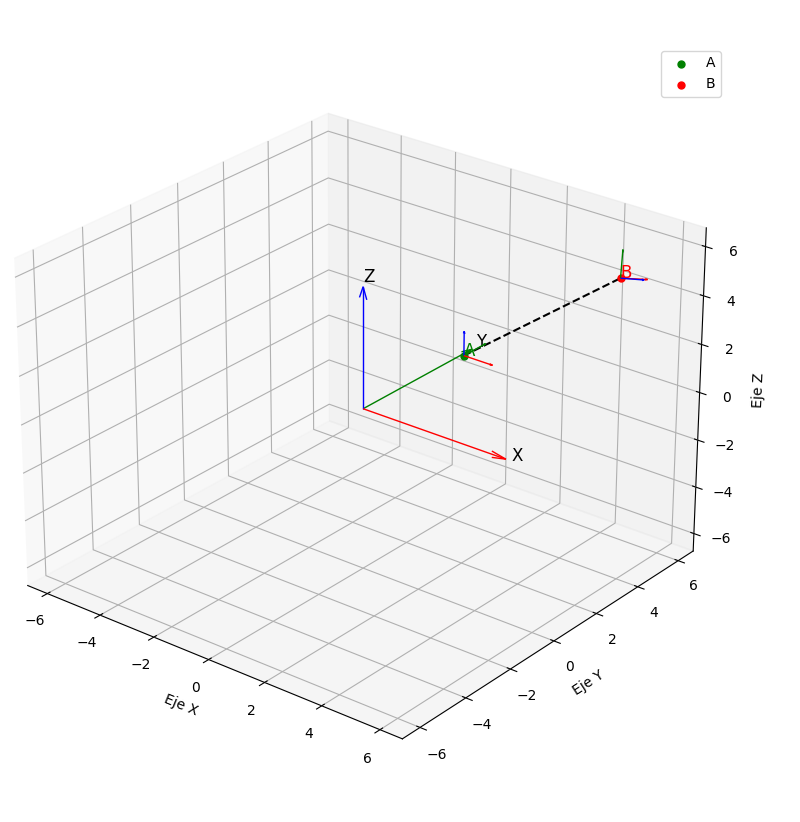
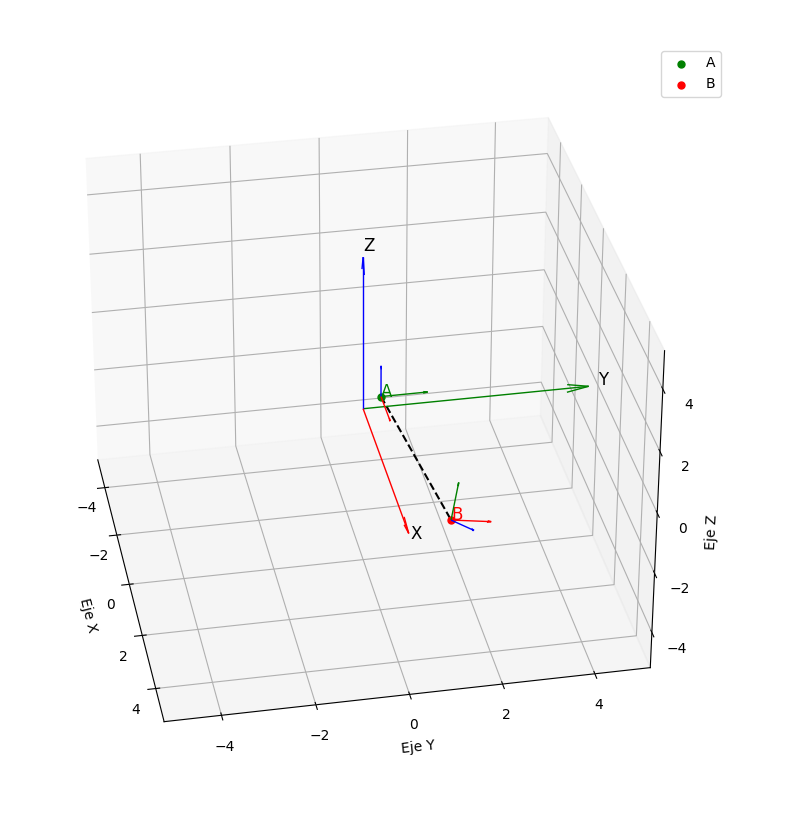
fig, ax = crear_plot()
# Definir el punto inicial en 3D
x1, y1, z1 = 2, 0, 2
P1 = np.array([x1, y1, z1, 1]) # Punto inicial en coordenadas homogéneas
eje_x = np.array([1, 0, 0, 0])
eje_y = np.array([0, 1, 0, 0])
eje_z = np.array([0, 0, 1, 0])
# Definir el vector de traslación en 3D
sx, sy, sz = 1, -1, -2
tras_m = np.array([
[1, 0, 0, sx],
[0, 1, 0, sy],
[0, 0, 1, sz],
[0, 0, 0, 1]
]) # Matriz de traslación en 3D
# Ángulos de rotación
#ang_z, ang_y, ang_x= 30, 45, 60
ang_z, ang_y, ang_x= 60, 45, 60
# Definir la matriz de rotación en 3D
alpha_z = np.radians(ang_z)
beta_y = np.radians(ang_y)
gamma_x = np.radians(ang_x)
rot_z = np.array([
[np.cos(alpha_z), -np.sin(alpha_z), 0, sx],
[np.sin(alpha_z), np.cos(alpha_z), 0, sy],
[0, 0, 1, sz],
[0, 0, 0, 1]
]) # Matriz de rotación en Z
print(rot_z)
rot_x = np.array([
[1, 0, 0, 0],
[0, np.cos(gamma_x), -np.sin(gamma_x), 0],
[0, np.sin(gamma_x), np.cos(gamma_x), 0],
[0, 0, 0, 1]
]) # Matriz de rotación en X
print(rot_x)
rot_y = np.array([
[np.cos(beta_y), 0, np.sin(beta_y), 0],
[0, 1, 0, 0],
[-np.sin(beta_y), 0, np.cos(beta_y), 0],
[0, 0, 0, 1]
]) # Matriz de rotación en Y
print(rot_y)
# Definir la matriz de rotación total
rot_m = rot_z @ rot_x @ rot_y
#print(rot_m)
# Aplicar la rotación y traslación al punto
P2 = rot_m @ P1
# Dibujar el punto inicial
ax.scatter(x1, y1, z1, color='green', s=25, label='A')
ax.text(x1, y1, z1, 'A', color='green', fontsize=12)
# Dibujar ejes en el punto inicial (trasladados, pero no rotados)
tras_eje_x = tras_m @ eje_x
tras_eje_y = tras_m @ eje_y
tras_eje_z = tras_m @ eje_z
ax.quiver(P1[0], P1[1], P1[2], tras_eje_x[0], tras_eje_x[1], tras_eje_x[2], color='r', linewidth=1, arrow_length_ratio=0.1) # Eje X inicial trasladado
ax.quiver(P1[0], P1[1], P1[2], tras_eje_y[0], tras_eje_y[1], tras_eje_y[2], color='g', linewidth=1, arrow_length_ratio=0.1) # Eje Y inicial trasladado
ax.quiver(P1[0], P1[1], P1[2], tras_eje_z[0], tras_eje_z[1], tras_eje_z[2], color='b', linewidth=1, arrow_length_ratio=0.1) # Eje Z inicial trasladado
# Dibujar el punto final
ax.scatter(P2[0], P2[1], P2[2], color='red', s=25, label='B')
ax.text(P2[0], P2[1], P2[2], 'B', color='red', fontsize=12)
# Dibujar ejes trasladados y rotados
rot_eje_x1, rot_eje_y1, rot_eje_z1 = trasladar_y_rotar_ejes(tras_m, rot_m, eje_x, eje_y, eje_z)
ax.quiver(P2[0], P2[1], P2[2], rot_eje_x1[0], rot_eje_x1[1], rot_eje_x1[2], color='r', linewidth=1, arrow_length_ratio=0.1) # Eje X
ax.quiver(P2[0], P2[1], P2[2], rot_eje_y1[0], rot_eje_y1[1], rot_eje_y1[2], color='g', linewidth=1, arrow_length_ratio=0.1) # Eje Y
ax.quiver(P2[0], P2[1], P2[2], rot_eje_z1[0], rot_eje_z1[1], rot_eje_z1[2], color='b', linewidth=1, arrow_length_ratio=0.1) # Eje Z
# Dibujar las líneas que conectan los puntos
ax.plot([x1, P2[0]], [y1, P2[1]], [z1, P2[2]], color='black', linestyle='dashed')
# Imprimir resultados
print("Resultados de la transformación:")
print(f'Matriz de rotación: \n{np.round(rot_m,2)}')
print(f"Punto inicial (x, y, z): ({P1[0]:.2f}, {P1[1]:.2f}, {P1[2]:.2f})")
print(f"Punto final (x, y, z): ({P2[0]:.2f}, {P2[1]:.2f}, {P2[2]:.2f})")
# Mostrar la leyenda
plt.legend()
plt.show()